Introduction
All our spreadsheet wants from us is each cell of data to be organised like a briefcase of money ready to be deposited by an investment banker into an offshore tax haven:

Image by Hair in the Gate. License unspecified: permission asked for in comments field (01/2013)
It has one type of item, arranged in a perfect, predictable way, in standard units. It probably even smells nice. The spreadsheet is happy with this situation, and will reward us by counting, sorting, charting and so on. However, what we often give to our spreadsheet is more like a toddler’s choice of essential items to take on a day out to the coast:

Image by Science Education Resource Centre. License CC-NC-SA 3.0.
This sort of soft toy chaos will make our spreadsheet punish us. Lots of different items, with different characteristics and features, all jammed into the same tiny space. What can we do to sort out this mess?
By the end of this section, you will have:
- Analysed data to highlight problems in the way it has been structured.
- Changed the structure of data to make it more useful.
- Some ideas about what to avoid in your own work with data.
Some work
To do both the quick and longer tasks below you’ll need:
- a spreadsheet tool, such as Excel or Libre Office.
- a copy of the course dataset, which is GRAIN’s data on “land grabbing.”
A quick task (15 minutes)
Download this sample worksheet and work through the steps below. This section uses some spreadsheet features for which some help can be found in the study section below. But give it a try first.
To start with, apply an AutoFilter to the data. Keep going back to the AutoFilter to see how the data changes with each step.
To demonstrate this problem, let’s say that we are collecting data and tracking who in the office attends daily meetings (I do hope your organisation doesn’t work with this terrible lack of trust!). The intuitive way to do it would be this way, as in the sample worksheet:
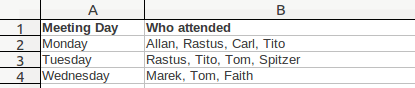
But spreadsheets aren’t intuitive. You couldn’t easily use this data to produce a neat attendance report using useful tools like AutoFilter or pivot tables. This is because the spreadsheet sees the text in each cell as one big glob of data, as if one person called “Allan, Rastus, Carl, Tito” attended Monday’s meeting. To make better use of the data that you have in front of you, the ideal situation is to have one piece of data of a single type in one cell.
So, let’s separate out the data, firstly into different columns. This can be done automatically using the Text to Columns feature in spreadsheets. Select the data in column B, and hit Data → Text to Columns. Select a comma to be the ‘separator’. You’ll get something like this (you’ll have to label the columns yourself):
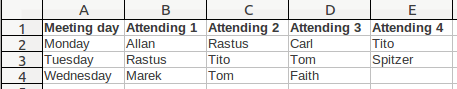
(After doing this, you’ll also have some whitespace. Refresh your memory on how to deal with this by looking at this earlier exercise called The Invisible Man…)
So, splitting the text across columns improves the chances of being able to analyse the data, but not by much. If you had a larger team, it would quickly become very tedious to use. What about taking the original data and arranging it down the column? This is called “transposition”. You can do it manually, or try it automatically using the “Paste Special” feature:
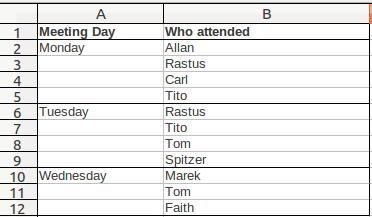
Far better! However, to make quick sense of the data we’ve had to add in some extra border formatting as data are now missing from the Meeting Day column. This is terrible (for why, see the section called Nuts and Gum). We’ll have to add in that data in column A:
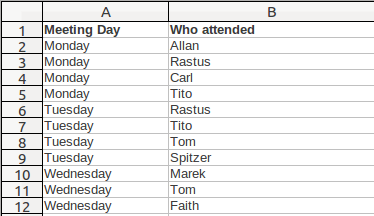
This approach allows the spreadsheet to sort, filter and pivot the data accurately. Try it! We can easily produce reports for who attended each meeting, which meeting each staffer attended, and also count and visualise it easily.
A longer task (30 minutes – 2 hours)
From the Data Wrangling Handbook Recipe on Data Cleaning, run through “Problem 5: Structural problems – data in inconvenient places” using the GRAIN dataset. This is a more detailed exercise that looks at what investors in large-scale land deals have said they will do with the land. It shows how this issue is being categorised, and the difficulties that spreadsheets have in recording multiple uses of land. It shows you how to use filtering to overcome difficulties in badly structured data.
If you are feeling very brave, also try “Problem 6: from “banabas” to “bananas” – dealing with inconsistencies in data”. This is an advanced exercise that walks you through the process of exploding, correcting and then reassembling a problem-ridden dataset to help you get more out of it. It makes use of a range of spreadsheet features including text-to-columns, regular expressions, pivot tables, conditional formatting, data validation and concatenation. It’s hard going, but at the end you’ll see data differently!
Reading list
In the short exercise we made use of the following functions:
- The Text to Columns feature, which is extremely useful in dealing with the “wrong suitcase” issue. Here’s a decent tutorial for using this in Excel, another for Open Office (and Libre Office). It may upset you to know that Google Spreadsheet doesn’t have a straightforward Text to Columns button! However, the SPLIT function achieves the same thing, as described in this tutorial.
- The Transpose feature, which swaps rows and columns around, is neatly described for Excel in this Tech Republic tutorial, and for Open Office by Solveig Haugland on her Open Office Training blog.
- The Tactical Technology Collective “Data and Design Guide” has a short chapter called Growing out of Spreadsheets, which is partly about this “wrong suitcase” issue. It looks at the difficulties of using spreadsheets when you have data that describes dynamic and complicated relationships.
Rest and reflect
What does the “wrong suitcase” problem tell us about recording data in spreadsheets?
You've finished this course! Go to the next course 'A Gentle Introduction To Exploring And Understand Your Data.'