Blog

By Mushon Zer-Aviv, January 8, 2016

How the simplistic network diagram came to dominate our imagination and why we shouldn’t blindly go with the flow. 

This is the third post in the #RDFviz blogpost series published towards the Responsible Data Forum on Visualization that would take place in New York on January 15th, 2016.

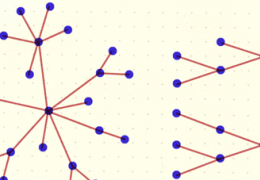
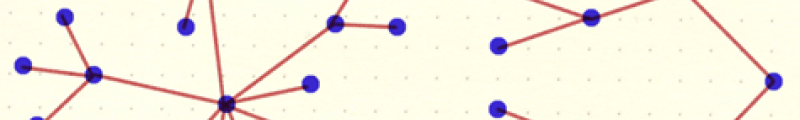
Let’s take a sheet of paper, draw a few points (we’ll call them nodes), connect them with lines, (we’ll call them edges) and there we go, we have ourselves a network. Right? Well, yes. And no. I mean, that’s not the whole story.

... Read more

By Melissa Ditmore with Maya Ganesh

October 26, 2015

For most of my career, I have worked with sex workers, people who use drugs, and transgender people around the world, primarily in Asia, Africa, and the United States. My experience gives me keen insight into ways information and data can be helpful for NGOs. But I’ve also seen the ways information about people can be used to harm them, especially people who do things that might be criminalized or whose very existence may be criminalized For the past three years, I have been working with ICASO, the International Council of AIDS Service Organisations, and the Civil Society Working Group on HIV, to advocate for the inclusion of human rights, and sexual and reproductive health and rights in the Sustainable Development Goals In this article, I want to... Read more

By Maya Ganesh, June 10, 2015

How much do you really know about how digital technologies work? Do you know where the cloud is and what it looks like? Can you describe how email works?

The mental models and metaphors of computing and the internet that we have can be hazy and sometimes, downright misleading. Evgeny Morozov says that metaphors such as the cloud, the Chinese fire-wall and the cold war can be thin indicators of  the material, political and social realities of computing and internet governance. Many of us have probably noticed that when some people talk about the cloud, they make an action pointing upwards to the sky; the fact is that the cloud is actually not 'up there' and is in fact only buildings around the world with rooms full of computers and servers.  Many of us use technologies... Read more

By Gabi Sobliye, May 17 2015

In the coming months we will post a series of posts under the title Anatomy of a Data Visualisation where we intend to dissect visualisations that we think are either innovative or offer fresh insights into the world of visualising information for advocacy. 

The first in this series is posted on International Day Against Homophobia, Transphobia and Biphobia as the visualisation in focus attempts to shift the casual use of homophobic language online. NoHomophobes launched in 2012 with the tagline “Homophobic language isn’t always meant to be hurtful, but how often do we use it without thinking?”

The website captures tweets in real time by scraping Twitter for mentions of... Read more

By Leil-Zahra Mortada, April 4 2015

Tactical Tech's has been documenting creative use of information and visuals for activism (10 Tactics & 10 Tactics Remixed) in addition to the resource and reference book "Visualising Information for advocacy" and in this post we present a thriving cluster of remixes, films and memes by Arabs ridiculing IS.

Despite the geographical proximity and the immediate threats of the Islamic State (IS), known in the Arabic-speaking region as Daesh,  Arab youth and artists are using humour and satire as acts of popular resistance and retaliation against IS' manipulation of Muslim and Arab culture(s). These take the forms of musical remixes of IS anthems, short parody sketches, dubbed scenes from movies and original works. Such work is important for its courage,... Read more

By Dirk Slater, Maya Ganesh and Beatrice Martini, April 17, 2015

This post is the second in a two-part series about sex work, trafficking and data. The first one is about how data "creates" the problem of trafficking through the generation of data. This second post is a set of  reflections and practical learnings from a community-owned, two year, 'small data' project Tactical Tech did with Women's Network for Unity, a Cambodian sex worker rights collective. This post goes into the history and outcomes of this project in some depth. We decided to write about our experience of working with WNU for two reasons. First, we had never really shared our experience of  this capacity building work in this context; and second, from the perspective of this blog, we wanted to close off this series on the dilemmas of data in advocacy by focusing on a story about people and communities using... Read more

By Maya Ganesh 16 April 2015

This two-part post closes a series on this blog about the dilemmas of data in advocacy.  The first post uses two cases to show how data is generated and deployed as a way of 'knowing' the 'problem' of trafficking; and how it serves as a rationale, then, for specific interventions to control trafficking. The next post is a series of reflections and practical learnings from a project we did with a Cambodian sex worker collective that was about 'small data' and building a community's capacity to own and generate data about themselves.

Trafficking is the local and international movement of people for sex-work, as human organ donors, migrant or bonded labour and (usually illegal) immigrants; of drugs ('drug trafficking'); human organs ('organ trafficking'); and weapons ('arms trafficking'). Victims of trafficking for sex come from a diversity of backgrounds and include displaced or stateless people, job seekers, tourists,... Read more

By Mushon Zer-Aviv, October 27, 2014

Since I first laid my cursor on Schooloscope.com it intrigued me as an exceptional case in the world of open data and information design. The chain of events that led to the site’s termination is an important story, which I believe should be chronicled and told.

Schooloscope was the brainchild of Berg London, a multitalented design studio. It launched in May 2010, funded by 4iP, Channel 4′s venture division that invested in innovative digital formats with a focus on public service projects. The site took performance survey data (Ofsted) about... Read more

By Maya Indira Ganesh and Morana Miljanovic, 15 October 2014

 Many activists and advocacy groups we talk to are not entirely sure why they should care about big data. What does it mean for our community?

Academics, think tanks, journalists and bureaucrats have been writing a lot about it. We also started finding and sharing the work of writers, artists and cultural producers who use their practice to represent and comment on what it means to live in such data-dense times. 

Much of this is interesting but we often found ourselves struggling to separate opinions from rants, and doomsday scenarios from empirical evidence. So, we thought we'd share a list of things that we found were accessible, critical and represented a range of actors talking about big data.

Admittedly, all of these recommendations are in English and are only reflective of our own interests. We'd love to see this list grow so if you have a suggestion for this list, let us know in the... Read more

By Marek Tuszynski, 18 July 2014

“A peculiar thing have happened to me: I suddenly forgot what comes first - 7 or 8?” Danili Khrams, Sonnet 

I like going to live performances; and I have noticed something that has became the norm nowadays: people waving hundreds of mobile devices in raised hands recording anything, anytime, anywhere.

But even when our hands are down, even when our fingers are idle, the recording goes on. What we record consciously is not that relevant any more.

The reality that matters now is not what we choose to photograph or film, the events we want to preserve for ourselves. Forget that plot, the idea that my life is a narrative that I can write down or film. We are not recording, but are being collected: our lives are being collected.

And in this collection it is the unmemorable moments that actually count. It does not matter what we think we are actually doing when we use all this battery-powered stuff. What... Read more

By Maya Indira Ganesh, 17 June 2014

The Numbers

In the 18 months between January 2009 and June 2010, in North Kivu province, eastern Democratic Republic of Congo (DRC), at least 6,334 women were raped by members of the DRC national army and Rwandan FDLR militia group. In South Kivu province the number was close to 7,500. Major General Patrick Cammaert, the former deputy commander of a United Nations Mission in Congo, said that “it is more dangerous to be a woman than a soldier in armed conflict.”

By Maya Indira Ganesh, 8 April 2014

When Viktor Yanukovych fled Kiev, he dumped a lot of incriminating paper documents into the lake on his lavish property. Shortly after, investigative journalists brought in divers who retrieved the documents, used hair dryers to dry them and then scanned them as .pdfs for future examination. Amongst the retrieved documents were receipts for Yanukovych's spending, names of blacklisted journalists and so on.

Technologies to retrieve, categorise, digitise and store the data embedded in these soggy paper documents are now accessible through investigative data journalism networks inspired and supported by people like Paul Radu. Radu's work and that of his organisation, the Organised Crime & Corruption Reporting Project, helps investigators and... Read more

By Maya Indira Ganesh, 13 March 2014

Data has always been crucial for advocacy and campaigning; from small NGOs and independent journalists to the United Nations, people working for social change have always had to use different kinds of information to make a case for their issue. So why is data the new bacon and why are there festivals, forums and conferences about it?

Data is not only the things you have to generate through quantitative and qualitative research with a design and hypothesis or question, which academics and marketers have done for decades; or ask for, like open data; or unearth and piece together like investigative journalists do. 'Big data', which has made the work of marketers, advertisers and surveillance agencies infinitely easier, is being imagined as a new tool to address social justice issues like corruption, poverty, humanitarian and natural disasters, and even predict outbreaks of... Read more

By Mushon Zer-Aviv, January 31, 2014

Seeing is believing.

When working with raw data we’re often encouraged to present it differently, to give it a form, to map it or visualize it. But all maps lie. In fact, maps have to lie, otherwise they wouldn't be useful. Some are transparent and obvious lies, such as a tree icon on a map often represents more than one tree. Others are white lies - rounding numbers and prioritising details to create a more legible representation. And then there’s the third type of lie, those lies that convey a bias, be it deliberately or subconsciously. A bias that misrepresents the data and skews it towards a certain reading.

It all sounds very sinister, and indeed sometimes it is. It’s hard to see through a lie unless you stare it right in the face, and what better way to do that than to get our minds dirty and look at some examples of creative and mischievous visual manipulation.

... Read more

Welcome to our new blog on data and design - an extension of the ideas from our new book,  Visualising Information for Advocacy.

As designers, activists, technologists and researchers, Tactical Tech has spent the past 10 years looking for opportunities to bridge disciplines: to bring design and information technologies into the world of activism. Following from our history of developing toolkits and guides that helped demystify technology for activists, we created drawingbynumbers.org  where we reviewed visualisation tools and shared advice on how to do-it-yourself. At the same time we were doing workshops, talking to activists and artists and wrote Visualising Information for Advocacy - showcasing visual advocacy and campaign examples from around the world to derive a framework for thinking... Read more