


This is a website where you can visualise data such as numbers, text and geographic information. You can create a range of visualisations including unusual ones such as treemaps and phrase nets. All the charts made in Many Eyes are interactive, so you can change what data is shown and how it is displayed.
Many Eyes is also an online community where users can create topical groups to organise, share and discuss data visualisations. You can sign up to receive notifications when there are new visualisations or data on topics you are interested in. Users can also comment on visualisations made by others, which is a good way to improve your work.
it is quick and easy to make and share great looking and fun to use visualisations from your own data.
only being able to use Many Eyes if your data and the visualisations can be shared publicly on the Internet.
Gentle
Yes, it is used online through a web browser.
First, register with the website so you can log in to it. Then add your data to the site by preparing it in a spreadsheet before copying it directly into Many Eyes. Once your data is in Many Eyes, you can experiment with different visualisations without having to add your data again. Many Eyes has clear but basic written guidance about the data and visualisation types. Once you have created a visualisation, it is possible to include it in your own website so others can see and interact with it.
HTML, Plain text and XLS
Embeddable and PNG
English.
You will need to create a user account with Many Eyes to use the website. This doesn’t have to be in your real name. However, everything you do on Many Eyes is public, including the visualisations you make and your source data. Other visitors to the website can copy your data and visualisations. This means that even deleting the data you have added may not remove it completely from Many Eyes. All visualisations can be exported and saved to your computer as images, but not as interactive versions.
IBM
Proprietary
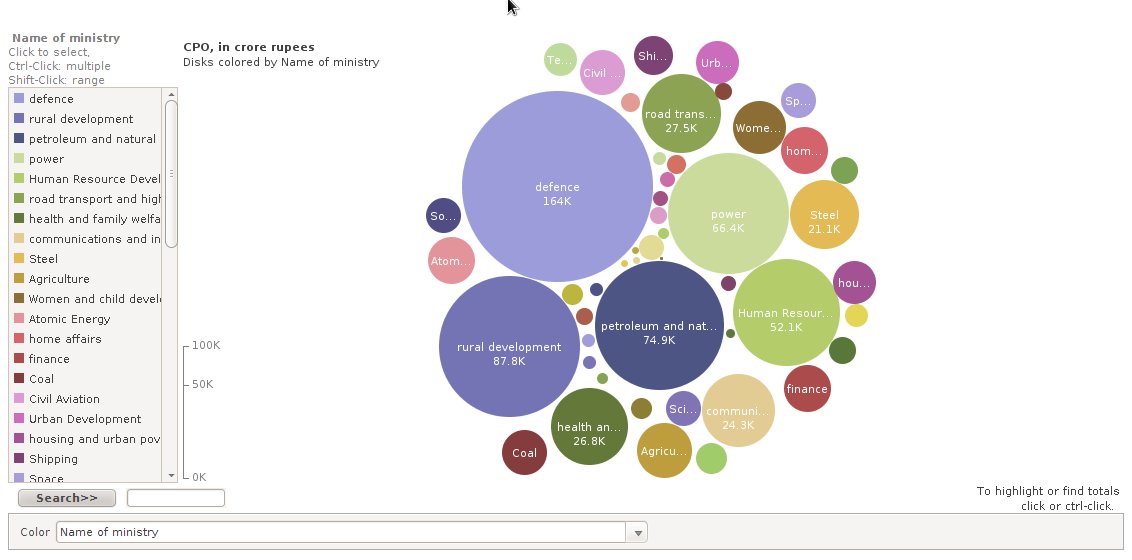
A bubble chart made in Many Eyes showing annual spending by Ministries of the Government of India.
The Guardian Data Blog used Many Eyes to illustrate the words used by the main actors involved in the phone-hacking scandal in the UK when questioned by politicians.