
This is the free to use version of the commercial data analysis and visualisation software called Tableau Desktop (which costs US $1000). You can use it to make interactive charts, graphs and maps from your data. Tableau Public is like a "visual-first" version of Microsoft Excel, enabling the creation of both simple and complex visualisations.
it's as easy to use as a spreadsheet and makes suggestions about how your data could be visualised.
getting stuck in the huge range of settings and ways to customise and change how Tableau Public shows your data.
Steep
No, it is installed on your desktop.
Download and install the software on your computer. Tableau Public will open spreadsheet files and show your data. As with a spreadsheet, you can have multiple worksheets in a single file and create several charts from the same dataset. Its charts are well-designed and simply styled to begin with, so it is easy to get a crisp, corporate look using Tableau Public. Anything you create can be embedded in blogs and other websites.
CSV
Embeddable, plain text and XLS
English and French
All privacy is explicitly built out of Tableau Public. Things you make with Tableau Public are saved on Tableau's servers, not on your own computer. They all have a specific web address that you can give to others so they can see your work. Your data, and the visualisations you make from it, are public and downloadable from the Internet by anyone. There may be some downsides to using Tableau Public with sensitive or politically controversial data. In 2010, Tableau Public was used by WikiLeaks to create interactive charts about data Wikileaks had obtained about US diplomatic behaviour. In response to requests from prominent US political personalities, Tableau Software removed the data.
Tableau Software
Proprietary
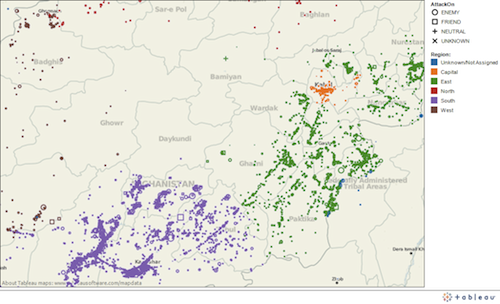
An interactive online map by Neil Houston that shows where military clashes during the war in Afghanistan have resulted in civilian or military deaths.


