

This is a spreadsheet application to create, store and analyse any kind of data, whether it's financial information about your organisation or a list of companies fined for violating environmental laws.
Spreadsheets store numbers, dates and text in tables, which are lots of cells arranged into rows (across) and columns (vertically). This data can be re-arranged, sorted and processed using lots of different mathematical formulas to answer questions that can help us make decisions or learn something about an issue. Spreadsheets also help you understand your data by enabling you to create different types of charts using your data, including line charts, pie charts and block histograms.
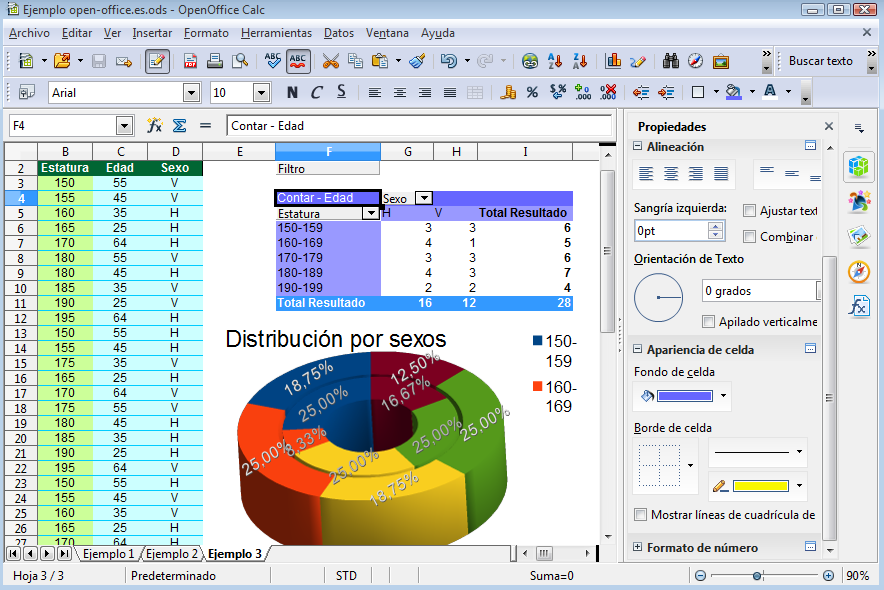
The most widely-used spreadsheet is Microsoft Excel, and OpenOffice Calc comes with a fairly similar range of capabilities. It can open and edit Excel files and several other formats. Calc's tools for making graph and charts are quite easy to use. You can change the size, type, colour and labelling of the visualisations you create. Charts are updated automatically if you change the data.
A great advantage of spreadsheet applications like Calc and Excel is the huge range of capabilities they have all in one place. The way they are part of suites of tools – such as OpenOffice and Microsoft Office – is also very helpful, since it makes exchanging information between spreadsheets and word processors, or presentation tools easier. However, this can also lead to problems. Spreadsheets do a little bit of a lot, so it often feels unnecessary to look for other sorts of tools with which to work with data.

it's a simple, non-technical way to put a structure on the information you have, do a little analysis on it, and keep updating it.
trying to do too much with just a spreadsheet.
Moderate
No, it is installed on your desktop.
After installing the software you start with a blank spreadsheet that contains many rows and columns. Spreadsheets store numbers, dates and text in tables, which are lots of cells arranged into rows (across) and columns (vertically). This data can be re-arranged, sorted and processed using lots of different mathematical formulas to answer questions that can help us make decisions or learn something about an issue. Calc's tools for making graph and charts are quite easy to use. You can change the size, type, colour and labelling of the visualisations you create. Charts are updated automatically if you change the data.
CSV, direct entry, HTML, XLS and XML
CSV, HTML, PDF, XLS and XML
Arabic, Brazilian Portuguese, Chinese, English, French, German, Japanese, Russian, Spanish and Vietnamese.
All files are stored on your computer, so you have full control over what you want to do with them.
Oracle
GNU LGPL