


This is an online tool that can be used to reformat, clean up and organise your dataset.
Once you have gathered your data and entered it into a spreadsheet you are left with the laborious, yet essential, task of cleaning it up. A messy dataset does not only hinder you from undertaking a meaningful analysis, but it can also prevent you from being able to use visualisation tools or statistical packages as many require specific formatting. Most datasets need some sort of 'cleaning up' to improve their quality; issues such as misspellings, missing data and duplicated entries need be identified and fixed.
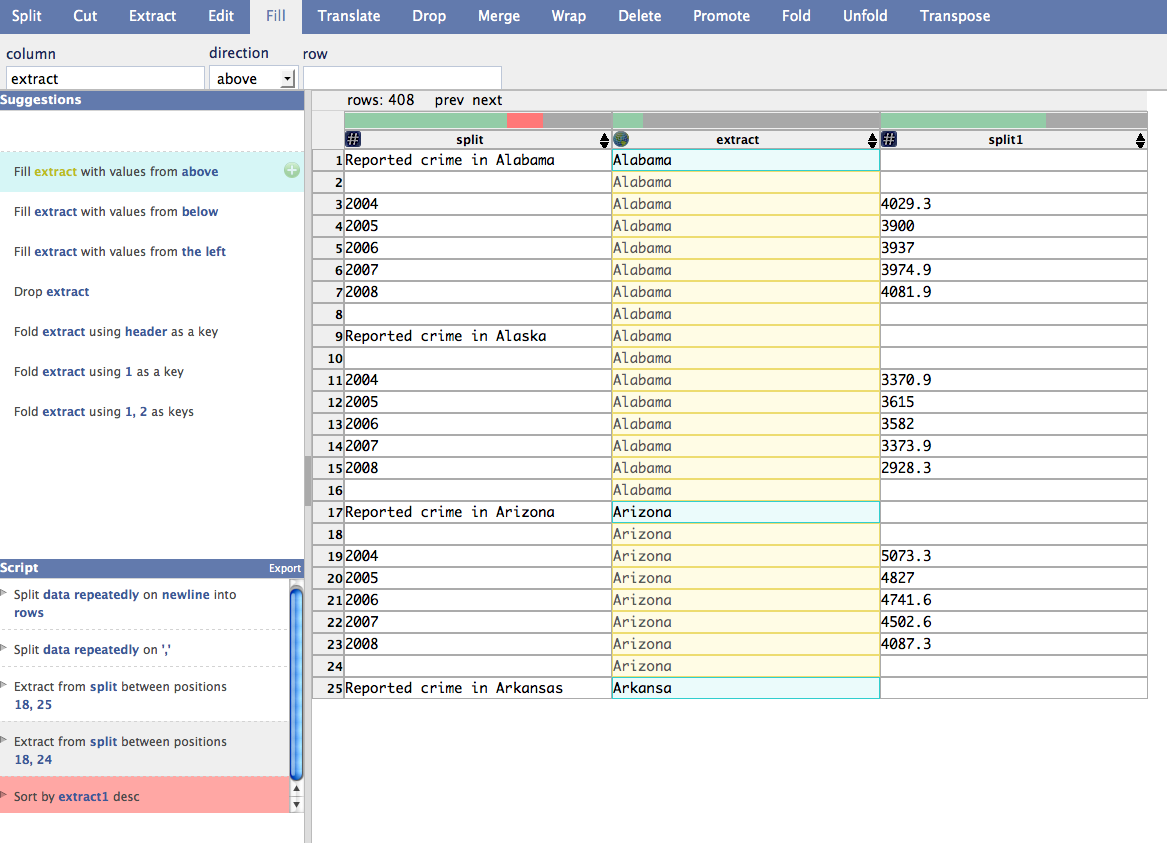
Rather than the traditional method of manual-editing, Data Wrangler offers 14 different options for formatting your dataset and within each of these options are a variety of choices. These functions let you split, merge, delete, promote, wrap, fold and unfold your rows or columns and also to cut, extract and edit your data. This variety of choices may seem overwhelming, but the tool helpfully suggests possible changes in rank-order and also offers visual previews so you can try the different options out before accepting them.
Data Wrangler enables you to reformat your data values or the layout of the dataset, amend incorrect or missing values and split entries into separate columns or rows. For example, if you were to choose the 'unfold' option it would allow you to identify different value types in one column and separate them out into new columns. Another example is the 'fill' option that identifies empty cells in your dataset and copies and pastes information contained in the preceding non-empty cells into these empty cells. This is a helpful function when dealing with visualisation tools as many will not work if a dataset contains empty cells, as they do not recognise them. It is often difficult to discover data quality issues and usefully Data Wrangler highlights errors in red and indicates whether a column has inconsistent data types and flags up the individual potential errors.
The tool has a interactive history function which keeps a record of the changes performed and also allows you to annotate the rationale behind the changes. This is useful when multiple analysts are using the same dataset and want to review, reuse or modify the previously applied changes to suit their particular needs and interests. An aspect of this tool worth highlighting, especially for those working with large datasets, is that you can choose to export your changes as code through either Python or JavaScript. Data Wrangler has a limit to the amount of data you can reformat using their tool, but this feature enables you to edit a sample of your data in Data Wrangler and then export the resulting script to use offline on your full dataset.
it leaves you with more time to analyse and visualise your data rather than potentially wasting hours rearranging your dataset into a useable format.
its privacy settings as the Stanford Visualization Group is logging the different steps taken by the user and also some specific details about your dataset (see more in Privacy and Portability).
Moderate
It can only be used online as it is a browser-based web application
Data Wrangler is free and used online through your internet browser. Like Open Refine this is not a spreadsheet application and should be used after the data has been collected and logged. Copy the data from a CSV file and paste it into Data Wrangler and click ‘Wrangle'. You should now see your data displayed on screen and to the left-hand side there is the interactive history bar and changes editor.
You can either specify changes to your dataset through clicking on the top of the screen and choosing out of the 14 options or you can directly manipulate the data by highlighting values and choosing from the changes that the tool suggests. Through using the history bar you can easily undo any changes and by hovering your mouse over the proposed changes you can preview their affects before accepting them. After you have made your selection and your dataset is reformatted and cleaned up you can then export your dataset either into CSV, TSV, JSON or LUT or into Python or JavaScript.
CSV
CSV, JSON and TSV
English
Data Wrangler is a web-based service that needs continuous broadband internet connectivity in order to work. To assess how the tool is being used Stanford Visualization Group is logging the different steps that users are taking and also some specific details about your dataset. On their website they state, “they do not transmit or store your full pasted data set” however there is no evidence to this effect.
Stanford Visualization Group
Proprietary