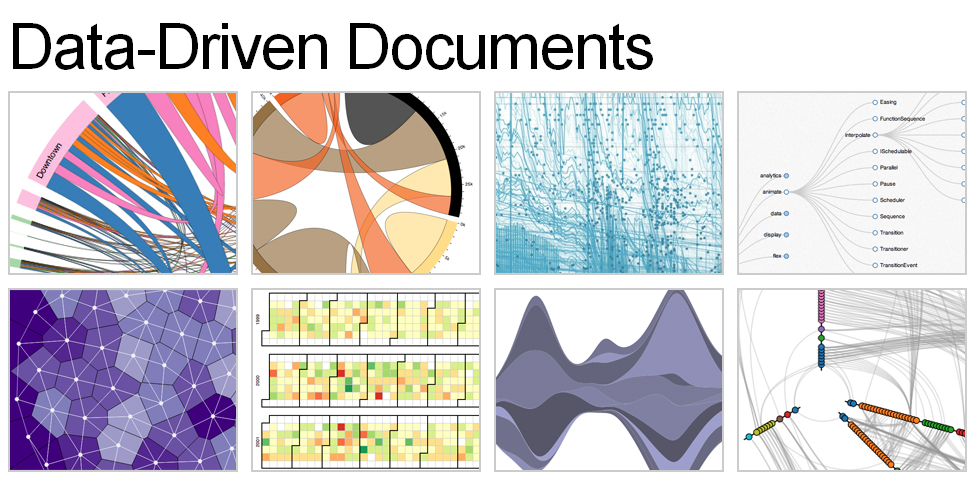
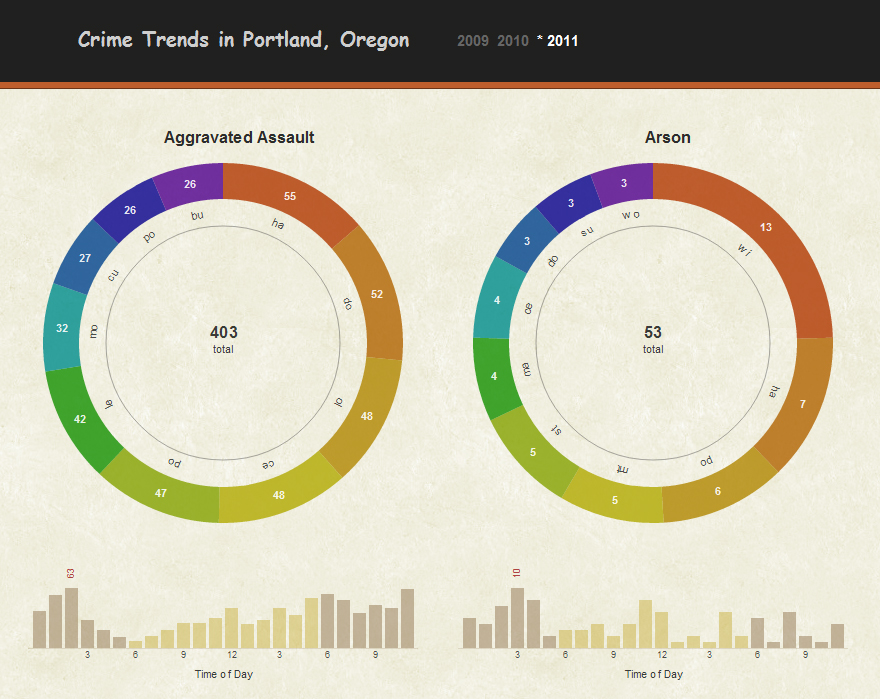
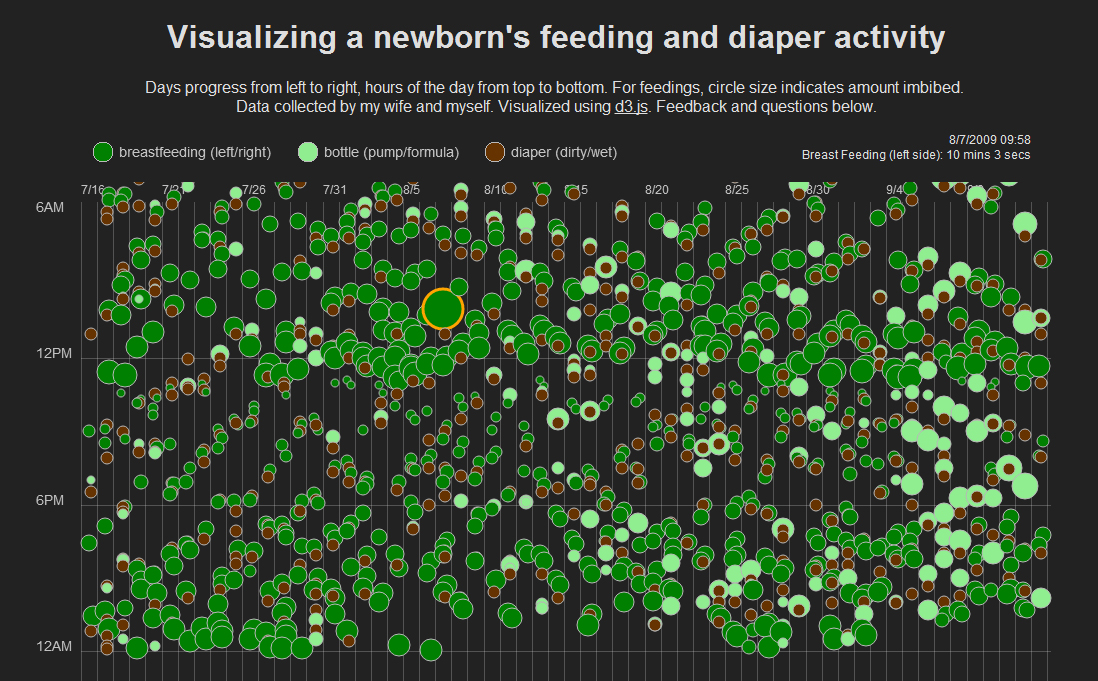
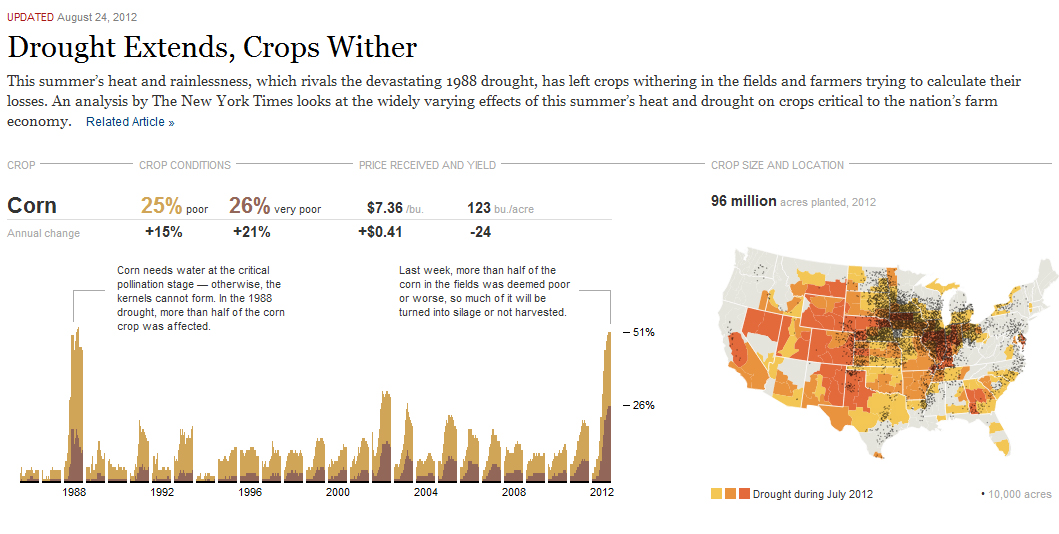
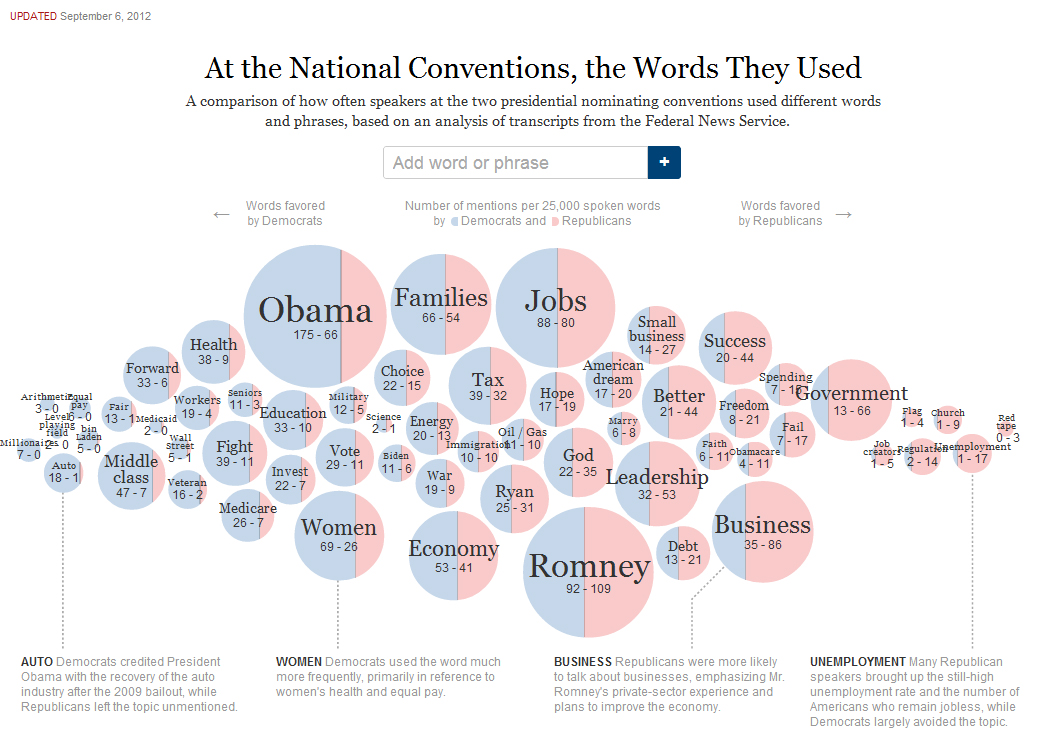
D3 stands for “Data-Driven Documents” and is a free JavaScript library that can create a wide variety of creative charts, maps and diagrams which can then be embedded into web pages. Take a look at the examples to get an idea of how powerful and flexible it is.
Graphics created with D3 don’t have to be static. You can create charts that change based on the user’s input. If, for example, you want to show various budgets for different countries, you could let the user choose which type of budget and which country they want to look at and D3 immediately changes the graphic based on these choices.
This flexibility comes at a price: D3 is not a piece of software that you use to easily design a graphic. Instead, you need to write rather complex code that tells the D3 library how to display your data. This means you need to understand JavaScript Objects, HyperText Markup Language (HTML), Cascading Style Sheets (CSS) and Scalable Vector Graphics (SVG) and you need to know how to write basic functions in code. If you are not a coder yourself, you will need help from somebody who has experience writing code.
The good news is that there are many tutorials and code-examples that you can play around with and re-use in your own projects.
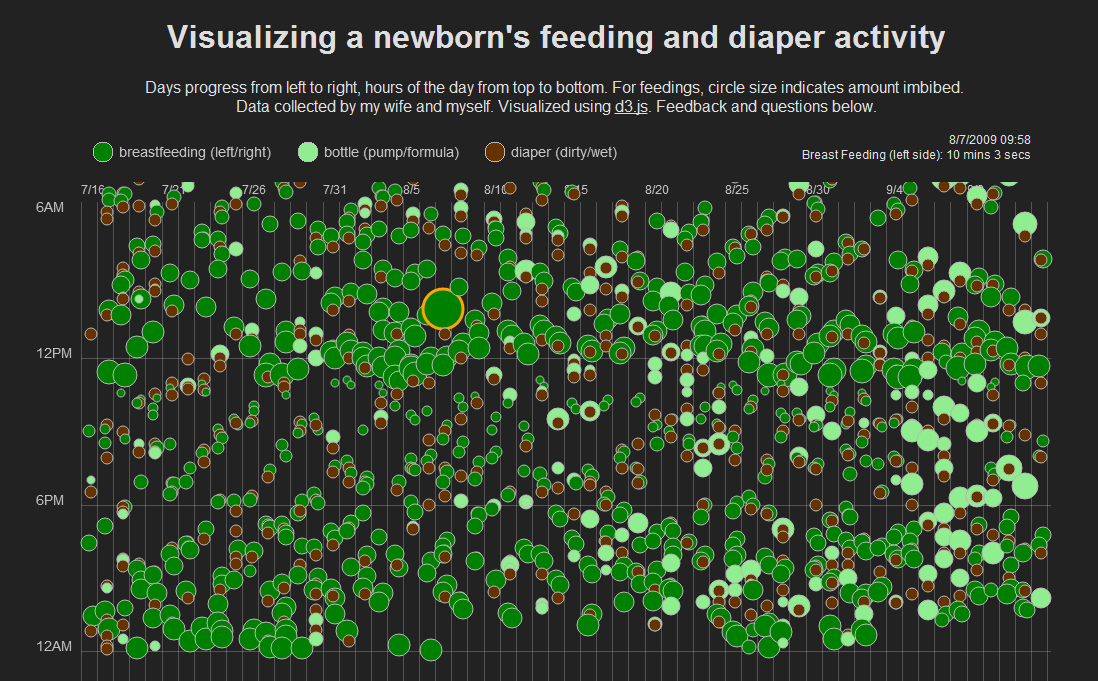
you can create rich and complex data driven visualisations. Since D3 can use data that is stored in a comma-separated values (CSV) file, the visualisation always reflects the latest version of the CSV. Once you have defined how you want to visualise your data, you only have to update the CSV.
backwards browser compatibility. While all major browsers support SVG as of 2011, older browsers such a Internet Explorer 8, might have problems displaying your charts properly.
The New York Times, which uses D3 frequently, has found a way around this problem which is documented on Jim Vallandingham’s blog.
Steep
You can either use it online or offline.
After referencing the D3 JavaScript library in your web page, you need to write the code to connect your data with D3 and to tell D3 how you want your information to be visualized.
Currently, there is no special code-editor with pre-defined D3 functions. This means you have to create everything from scratch or manually modify the examples from the Github library. You can either show the final visualisations in a web browser on your own computer or embed it into a web page.
CSV, direct entry and JSON.
Embeddable, HTML, SVG and XML.
English.
Privacy and portability are not dependent on D3 but on where you host and display your data and your visualisation. In practical terms that means: if you want to keep something really private, you can keep the data on your machine or local network and look at it by opening the HTML-file that contains your graphic. On the other hand, if you upload your visualisation to a server on the internet, then it'll obviously be visible to anyone who knows the web-address. It all depends on where you store the data.
Mike Bostock
BSD.
To get an idea of the incredible variety of visualisations you can create with D3, go to Mike Bostock’s Github gallery.
Ben Lorica also provides a good overview of some basic static charts that can be created with D3. While not as mindblowing as the Github gallery, many of these examples are probably closer to the everyday needs of many users.
To get an idea of how D3 can be used for interactive graphics that change based on user selections, take a look at this project showing data about roller coasters.


