


R is a highly extensible language and environment for statistical computing and graphics. It provides a wide variety of statistical, such as linear and nonlinear modelling, classical statistical tests, time-series analysis, classification, clustering and graphical techniques.
As described by Inside-R, R is a number of things:
R is data analysis software: data scientists, statisticians, data journalists, analysts and others who need to make sense of data use R for statistical analysis and data visualisation.
R is a programming language: you can do data analysis in R by writing scripts and functions in the R programming language. Because R is a complete, interactive, object-oriented language: designed by statisticians, for statisticians.
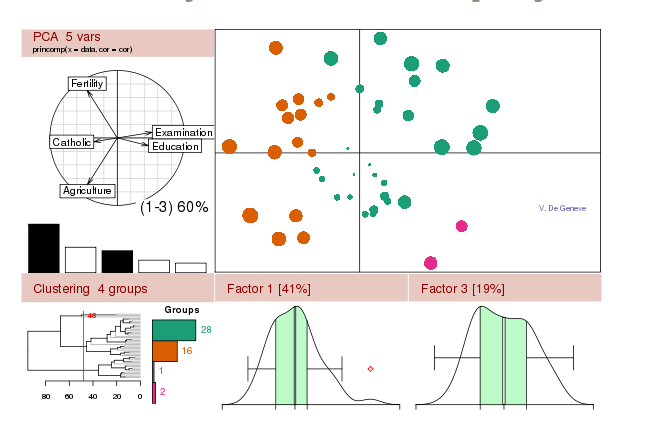
R is a great tool for data visualization. One of the design principles of R was that visual exploration of data through charts is an essential part of the data analysis process. As a result, the R package includes excellent tools for creating graphics, such as bar charts, scatterplots or multi-panel Lattice charts. You can use R to generate new visualisations based on your needs. R's graphical system is heavily influenced by thought leaders in data visualization like Bill Cleveland and Edward Tufte, and it's used by data visualisation stars like the New York Times, the Economist and FlowingData.
Finally, R is an open-source project: you can freely download the R package and start running experiments with it. Its robust and vibrant community of users constantly discuss and suggest new uses of the R project and share their source codes.
It is highly extensible and tremendously powerful for analysis and statistics.
the need for familiarity with programming as well as statistics.
Moderate
No, you can code your R script offline from your desktop.
The best thing to do if you want to start using R is to read the official introduction to R. Another good way to start coding a R script is to follow the "R by examples", have a look at the source codes and try to tweak them to see what happens.
You could load your CSV dataset in it. R is excellent for "mash-ups" with other applications: combine R with a MySQL database, an Apache web-server, and the Google Maps API and you've got yourself a real-time GIS analysis toolkit.
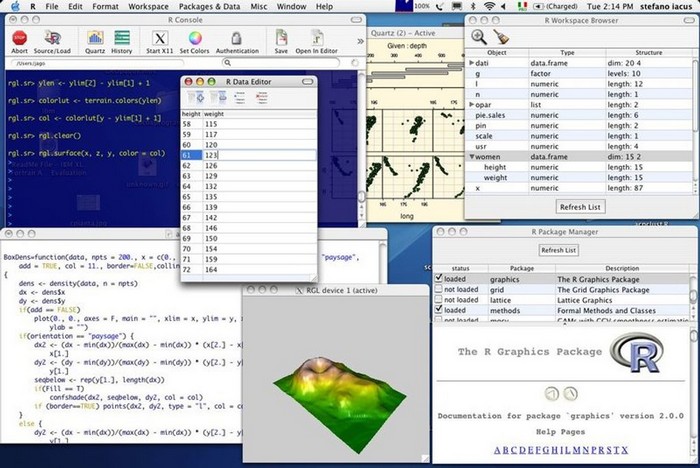
You can code your R script, run it and print the output directly on your command line. If you want to code from a handy desktop interface, you can use a IDE software, such as Eclipse.
English
No, R is a programming language and it does not communicate any private data without your authorisation.
R is free software. The R foundation – a no profit organization – holds and administrates its copyright.
R is available as Free Software under the terms of the Free Software Foundation's GNU General Public License in source code form. It compiles and runs on a wide variety of UNIX platforms and similar systems (including FreeBSD and Linux), Windows and MacOS.
You can find plenty of examples on the R website:
To learn R we recommend to start with the following resources:
- The official list of R manuals
- The R Journal
- A list of books related to R and its packages
- Tutorials by R-Tutor
- An introduction to R