


Exhibit was created to let journalists to create data-driven visualisations easily, without too much programming. It lets you easily create web pages with advanced text search and filtering functionalities, with interactive maps, timelines, and other visualisations.
It is easy to use if you know some basic HTML.
The design of the visualisations is not easy to customise. Also watch out for trying to visualise large data sets - Exhibit is designed for small data sets.
Moderate
Not necessarily. You can download the Exhibit javascript library and use it offline on your browser.
There is no software to install. Exhibit is implemented as an open source javascript library you just include in your web page. However, since it works entirely on the client browser, it can be integrated into the CMS you are using.
To make an Exhibit you need some data. Tabular (spreadsheet) data is a good starting point. Each column should describe a different named property of a data point. You'll want a header row in your table, giving the names of these properties. The entries in the cells provide values for the various properties of the item. These values can be for example numbers, strings or dates.
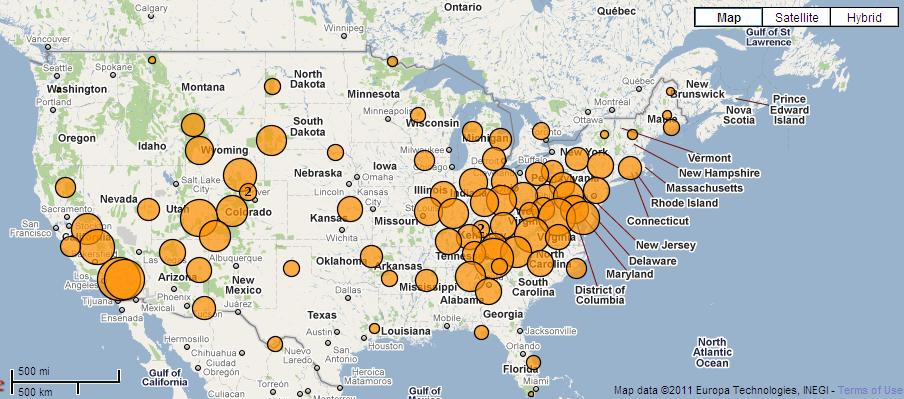
With Exhibit you can create your data-driven web page by putting together a simple series of HTML tags. Exhibit offers many types of visualisations – e.g., lists, thumbnail galleries, maps, timelines, and charts. We'll begin with the default, the "list of items" view.
To produce this, you just need to place a "view" tag in the HTML wherever you want that view to appear. For example, <div ex:role="view"></div>. You can add timelines and interactives maps in minutes by following the guidelines reported in the Exhibit's hands on guide.
Exhibits supports a number of data formats, such as CSV, JSON, TSV and can read its data directly out of a Google spreadsheet.
You can export your Exhibit source in HTML format.
English
Yes. If you decide to include a Google map, please bear in mind that Google will store and track your personal data.
Exhibit is free software and was originally created by David François Huynh.
Exhibit is open source software and is licensed under the BSD license.
- Double dippers expose at the St Petersburg Times
- Teacher bonuses evaluated at the St Petersburg Times
- Bridge safety at Minneapolis Star Tribune
- Crime map at the SE Missourian
- Music Composers
- Gina Trapani's broadway shows
- World Cup
- Russian Justice Initiative Cases at the European Court for Human Rights
As reported on Exhibit's website, as you build your own exhibits, you'll probably want to look at a bunch of examples. Since these are just HTML files, you can download them and they'll work; then you can start to tweak them.
The Exhibit web site contains examples that the Exhibit team has built alongside examples that others have made to give users an idea of what can be done with tool.
Have a look at the Exhibit reference documentation which lists the different exhibit tags and options.