


This is a piece of software for making maps, charts and diagrams using your own data. Visualisations made in VIDI are interactive and can be embedded on your website.
It is free to use and adapts to fit your needs. The software asks you about the kind of data you want to use and suggests which kind of graphic would be best suited to visualise it. To take full advantage of VIDI, you will need some technical help installing it on your web server. This makes it a bit more difficult to bring into your work than 'ready to go' systems like Google Spreadsheets. While the software is in English, VIDI can display data in different languages and can be translated into other languages.
VIDI's easy-to-use demonstration website allows you to use your own data to try out over 20 different sorts of data visualisation.
having to embed the visualisation on your website and being unable to export it in other formats.
Gentle
Yes, it is used online through a web browser.
VIDI does one thing: it displays the data you put into it. VIDI won't help you organise and analyse your data like a spreadsheet might. It has useful guidance on the sort of data you will need for each visualisation, and gives advice on how to prepare that data for use in VIDI.
CSV, direct entry, TSV, TXT, XLS and XLSX
CSV, PDF, TXT, XLS and XLSX
Using VIDI in your work really means running the VIDI software on your own web server. This gives you full control over how this data is stored, displayed and accessed by your audiences. However, this means you are also completely responsible for the security of the website in which you are running VIDI. VIDI runs with a free content management software called Drupal. So in order to ensure you are running VIDI securely you'll need to understand how security works in Drupal.
The Jefferson Institute, a US-based non-profit organisation.
Cairo Protests Map and Timeline shows how the protests in Cairo developed over time.
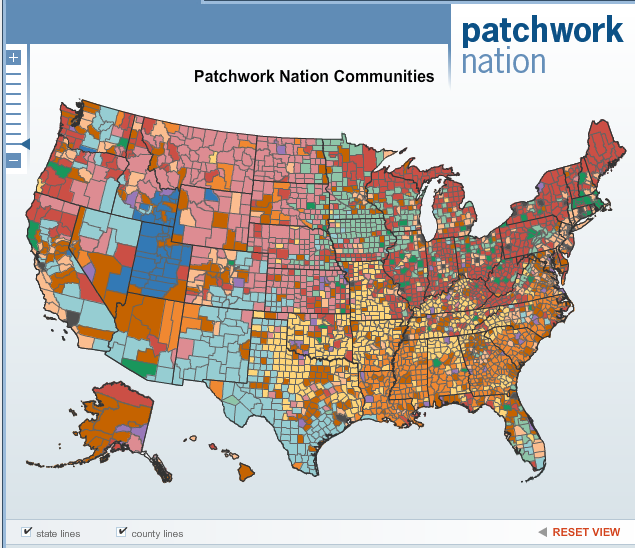
Patchwork Nation maps social and economic data for the United States.