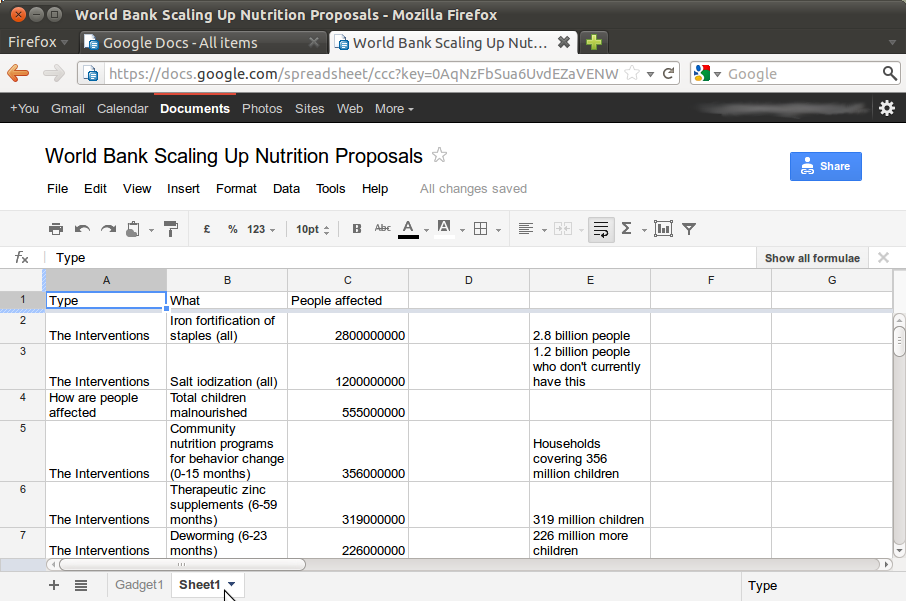

This is an online spreadsheet tool and is part of the “Google Docs” suite of office tools. It is free to use, but as with all Google tools you will need a Google account. It works similar to Microsoft Excel or OpenOffice Calc: you can enter numerical data or text in rows and columns and there is a powerful range of formulas for working with data.
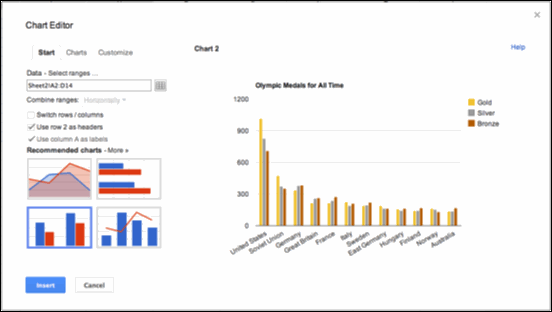
Google Spreadsheets offer a wide range of ways to visualise your data. Most are interactive and are designed to be shared over the internet. It also enables data that includes geographical information, such as addresses, to be displayed directly on Google Maps.

you can add existing spreadsheets to Google Spreadsheets, share them online and collaborate with others.
using it on slow internet connections, which can make Google Spreadsheets quite unusable.
Yes.
You can do a lot quickly in Google Spreadsheets. Three functions in particular are combined in Google Spreadsheets that make it very useful as a time-saving data management platform. Firstly, you can collaborate on data that would otherwise be in a spreadsheet on one person’s computer. You can see who added or changed what, and watch each other work on the same sheet, rather than emailing around different versions. Secondly, data can be added to Google Spreadsheets by way of simple online forms. Finally, it's easy to publish the data and visualisations you make by embedding them in other webpages or simply granting public access to the data.
CSV, Direct entry, TSV, TXT, XLS and XLSX.
CSV, PDF,TXT, XLS and XLSX.
HTTPS is used throughout the service. Google privacy policy and standard Terms of Service apply to this tool. All data can be taken out of the system. Your creations, like charts and maps can be exported as images. After making a chart in Google Docs you can export it as an image for use in a publication. However, the interactive versions of your charts will only be available for use within Google Docs.
Here are over 20 interactive examples of making visualisations in Google Spreadsheets.


