


This is an online mapping tool that helps you tell a story and communicate complex information through eye-catching maps. Your data can either be used as a static map or you can create an interactive animated map which enables the viewer to see data displayed in set locations and visualise changes over time. By using spreadsheets from Excel or Google Docs you can map any dataset that is linked to an array of locations such as IP addresses, street addresses and longitude and latitude coordinates.
In order for the tool to recognise your data they must be entered correctly and clearly; if the programme cannot recognise your data, it will alert you so you can go back and fix the dataset. If you don’t mind publishing your dataset online then Google Docs is a more flexible tool than Excel as you can change entries on your spreadsheet which OpenHeatMap then automatically updates on your map. Once your data has been imported you can then customise your map by adding titles, changing the colours and sharing the map by embedding it into your website or sharing a link to it. Sharing a link to your map is simple however it gets more complicated if you want to host it on your website.
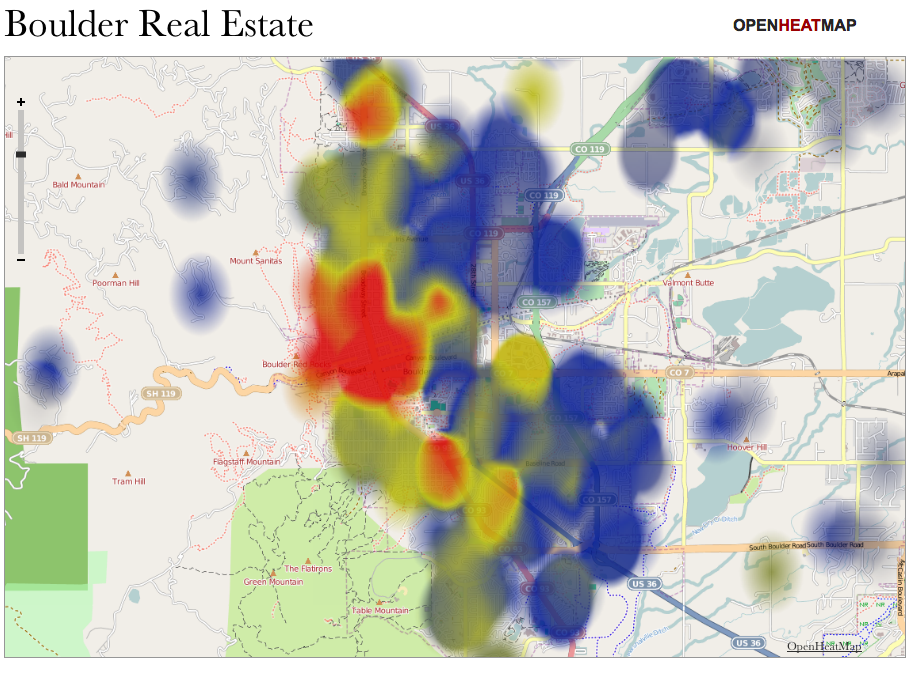
it's easy to use and will accept most types of data you enter into it. Unlike Google Maps it can handle thousands of plot points by blurring points together into larger points that can illustrate particular concentrations in certain locations.
getting the names of your columns right as OpenHeatMap relies on a certain header format to know what kind of map to make. Also watch out for unreliable internet connectivity issues with OpenHeatMap's website which is frustrating if you have embedded a link to your map on your website and instead of your viewers seeing your map they see an error message.
Gentle
Yes, OpenHeatMap is a web-based service so you need Internet connectivity in order to use it.
Save your data as either a CSV file on Excel or as a Google Doc and upload it to the OpenHeatMap website. Once uploaded click ‘view my map’ and you will instantly see your map, which you can tweak by adding a title, changing the scale and colour key and then publish it to the website for others to see.
If you want to display your data as an animated map then name a column in your spreadsheet ‘time’ and OpenHeatMap will use it to build the animation and it will visualise your data over time through using a timeline by pressing play or scrolling through manually.
CSV and Google Docs
Embeddable and HTML
English.
All data uploaded is viewable by the public so this is not suitable for private or sensitive information. Also be aware that when you are using Google Docs you must publish the spreadsheet online before OpenHeatMap can access the information. OpenHeatMap is a web-based service so you need Internet connectivity in order to use it.
OpenHeatMap was started as a personal project by Pete Warden in 2010
GNU GPL
An example from OpenHeatMap of an animated world map demonstrating an array of World Bank Data over the last 60 years.
The Guardian Datablog used the local authority specifications to map carbon emissions in the UK from 2005 - 2008.