


With Lyra you can create complex visualisations without the need of some difficult javascript code. You can think of it like an open source Adobe Illustrator, but focused on data visualisations.
If you want to create complex data visualisations but you don't have time to start coding, Lyra could be a good option. Lyra allows you to load your dataset and create visualisations around it like if you were using D3JS or Processing. You can bind your datapoints to graphical “marks”, place the graphical elements dynamically using connectors and move, rotate and resize elements with your mouse. The authors say that Lyra is more expressive than softwares like Tableau, allowing designers to create visualizations comparable to hand-coded visualisations built with D3 or Processing. The finished visualisations can then be easily published online, or exported as PNG or vectorial images.
you can create complex d3js-like visualisations without code.
Lyra is currently in beta mode, so beware of bugs.
Moderate
Yes. You can access Lyra's interface from your browser by going to the Lyra website.
Just load your datasets and start playing with the interface. If you don't know where to start, follow the introduction video below:
You can easily load CSV and JSON files into Lyra to begin creating your visualisations.
You can export your work as SVG or PNG images. You can also export as a Vega spec to allow for more interactive features.
English
Be careful when you visualise your dataset as it could contain personal data and if you embed the visualisation on your dataset, then anyone can access and download it from the source of the webpage.
Lyria was developed by Arvind Satyanarayan and Jeffrey Heer.
Lyra is released under copyright 2014, UW Interactive Data Lab (read LICENSE file).
- Make a barchart with Lyra
- Napoleon's March to Moscow remade with Lyra
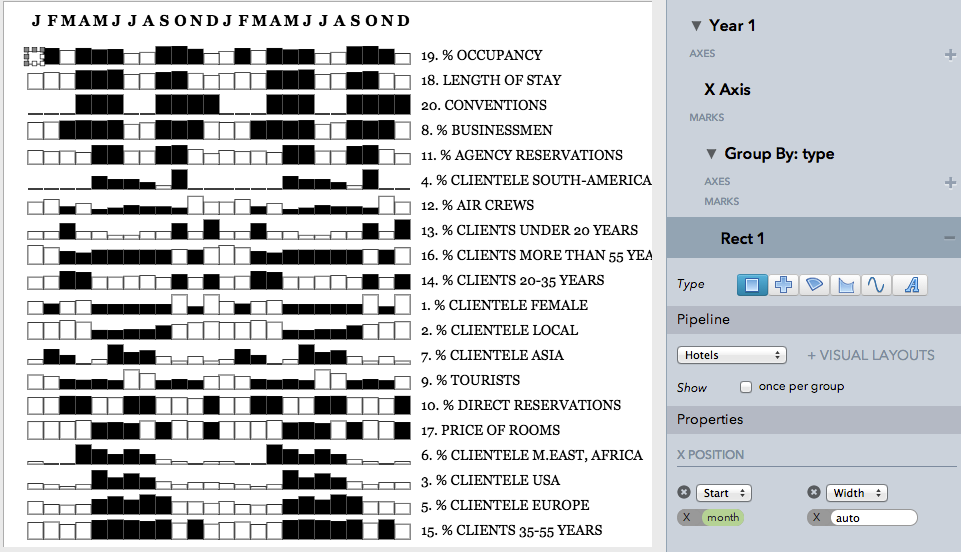
- Analysing hotels with Lyra
Visit the wiki for documentation and tutorials that walk you through the process of building visualisations in Lyra.