


TileMill is an open source desktop software which can turn Geographic Information System (GIS) based data into beautiful thematic maps. At heart it’s a specialised Cascading Style Sheets (CSS) editor that helps you customize all elements of your map and highlight the information that is important to you.
TileMill accepts data from a wide variety of sources and can produce both dynamic and static maps for documents or websites. TileMill intregrates closely with MapBox, an online map creation service. TileMill comes with a “Crash Course” which is essentially a short tutorial that explains the basics of the programme.
once you have grasped the basics, being creative is more easy in TileMill then in Google Maps or Google Fusion Tables. While the Google products are excellent for specific purposes such as simple heat maps, TileMill gives you much more flexibility in the design of your maps. However, initially the learning curve for TileMill is steeper than in these consumer-oriented products. Take a look at the examples below to get a better idea of what is possible with TileMaps.
data that is not in the exact format that TileMill expects. Even some of the recommended data sources on the TileMill website don’t provide data in the exact format that the software needs. This means you will most likely need to spend some time cleaning up and transforming your data with tools like Open Refine or Data Wangler.
Moderate.
No, it is installed on your desktop.
After importing clean GIS-enriched data, you can style the data points with a CSS flavor called CartoCSS. For anyone who knows CSS, the format and the options will be easy to grasp. However, users with no previous CSS knowledge will struggle.
By adding different shape files and layers, you slowly enrich the map. A sizeable selection of shape files and layers such as administrative borders can be imported by browsing the MapBox data sources.
You will most likely need additional mapfiles or polygons, for example from Cloudmade for your projects.
CSV, JSON, KML, own data source and XML.
Embeddable, PDF, PNG and SVG.
English.
Maps exist on your computer but can be also uploaded to MapBox where up to 3,000 map views per month are free.
You can also embed the map in your own website or include it as a PDF or as an image file in websites, presentations or documents. By default TileMill files are saved in a proprietary format.
MapBox
BSD.
Below are three great examples of TileMill in action:
How TileMill Is Mapping Support of the International Justice System
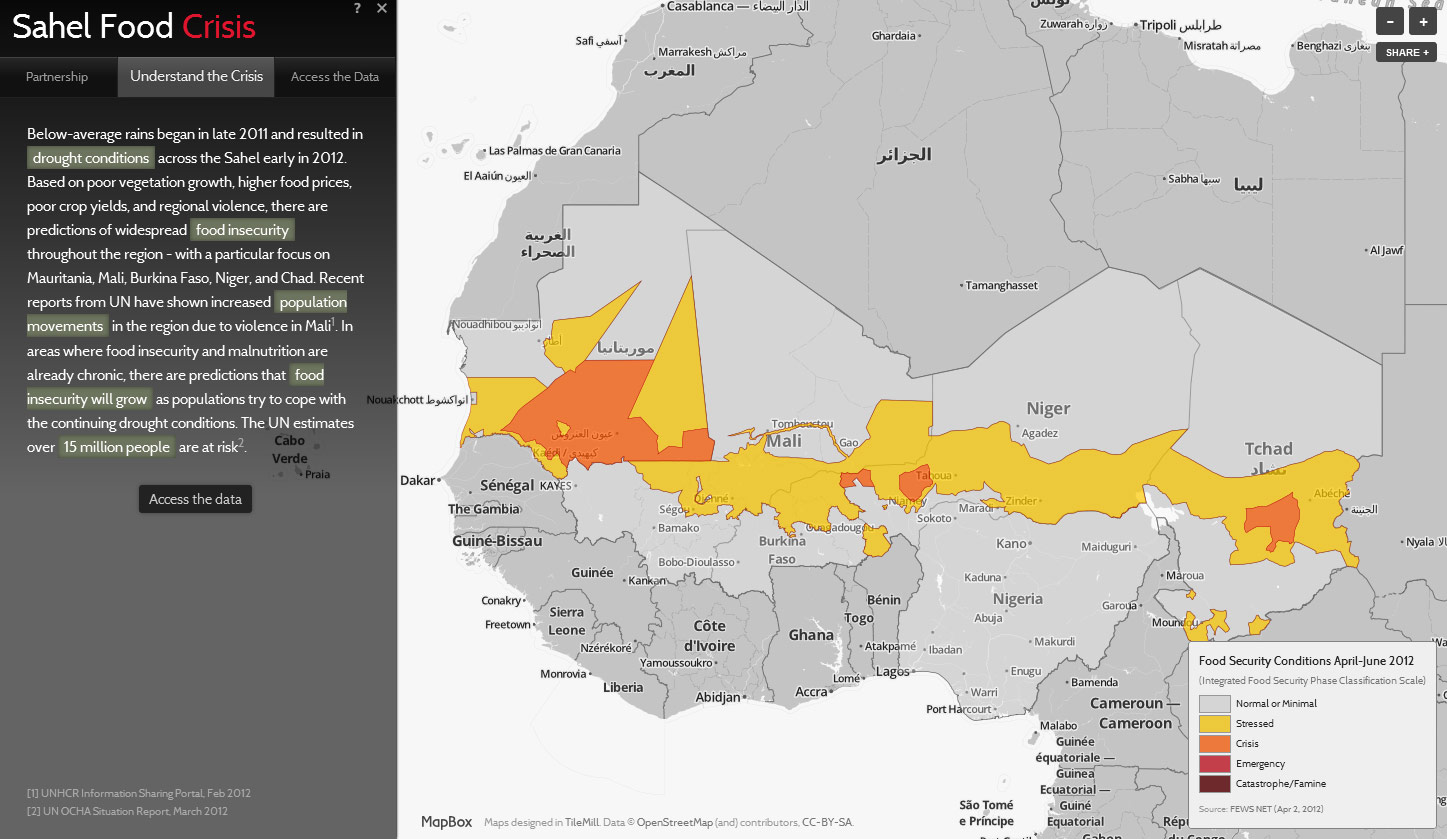
How SahelResponse.org Used TileMill, Open Data to Respond to Food Crisis in Africa