


RAW is defined by its authors as "the missing link between spreadsheets and vector graphics". In other words, RAW is a user-friendly web app that facilitates the creation of custom vector-based visualisations through drawing on a d3.js library. RAW has not been designed to create pie or line charts, but to visualise flows, clusters, hierarchies and correlations by displaying data with some non conventional layout. As the authors explain, RAW is "not intended to be a full visualisation tool like Tableau or other similar products: as the name suggests it is a sketch tool, useful for quick and preliminary data explorations as well as for generating editable visualizations". So feed your dataset into RAW and visualise it with one of its layouts, save it in SVG and feel free to modify it with an vectorial editor such as Inkscape or Illustrator.
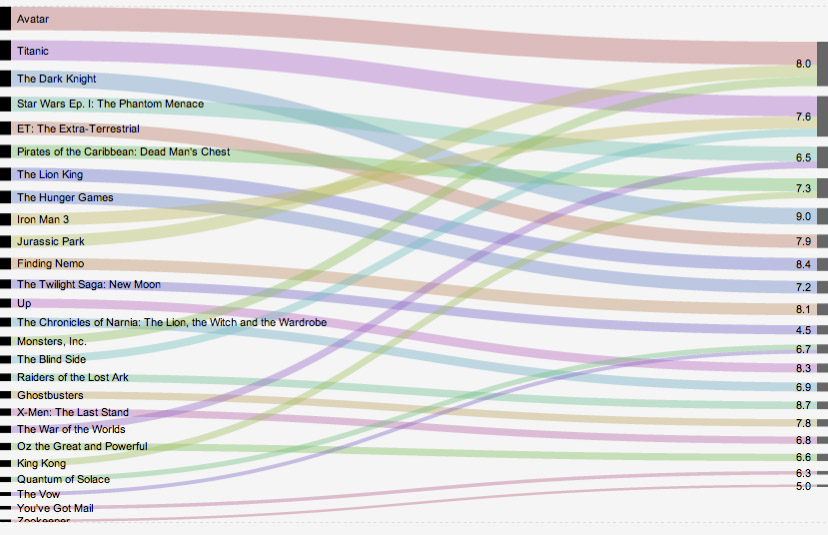
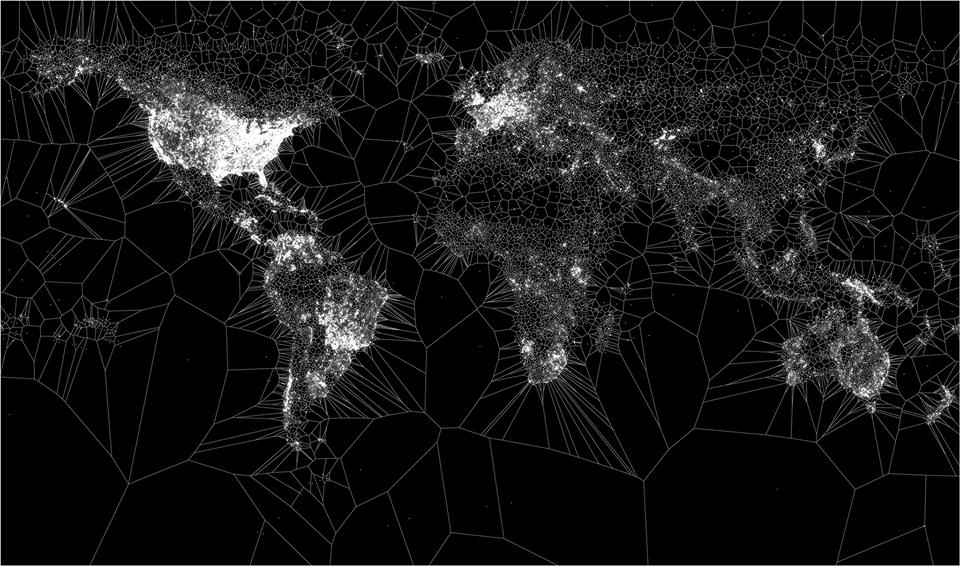
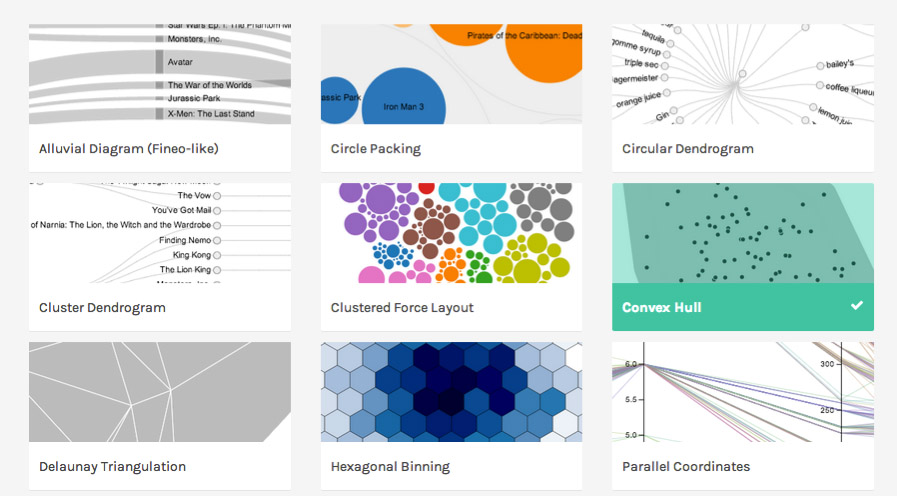
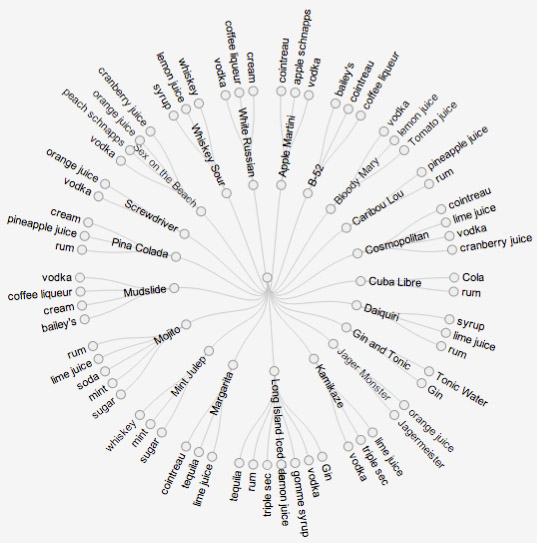
It helps users with no coding skills to generate non conventional vectorial charts, e.g. dendrograms, streamgraphs and alluvional diagrams.
The need of knowing what kind of insights or relationships (e.g. hierarchical) you want to let emerge from the data and the consequent format of the dataset. This requires a certain degree of familiarity non conventional data visualisations. Moreover, Raw is designed to create visualisations for printing media and does not allow the creation of interactive visualizations that would be possible by using directly the d3.js library.
Moderate
No
First you need to copy and paste your CSV dataset in the input box. Once Raw has parsed your data, you can check the table and delete any rows that you do not want to show in your final visualisation. After that, you will be able to select the layout of your visualisation and choose the variables you want to use as dimensions in the chart. Once you have done that, you can customize the size and colours of the chart. Finally, you can export the chart's embed code or export it in SVG, PNG or JPG format.
You could check the sample datasets to see how the input data has to be structured. That is what makes this tool special: all what you need is a CSV dataset that fits with one of the charts, configure it through RAW's web interface and save the final output. The visualisation can be exported in vectorial format (SVG) so it can be easily imported and modified with a vector graphics editor such as Inkscape. Alternatively, you can copy the chart's embed code and paste it in your website as if it was a YouTube video.
CSV
SVG, PNG, JPEG.
English
The data you upload will be processed only locally by your web browser. There are no server-side operations and your data will not be stored.
RAW is provided under the LGPL (Lesser General Public License).
- RAW sample datasets (click on choose one of our samples)
- Alluvional chart published by La Lettura (Corriere della Sera, Italy)
Tutorials
This helpful tutorial by Tarek Amr from the School of Data.
This video explaining the tool produced by its creators Density Design